Our services around Sensu Go
Implementation and configuration
Implementation and configuration of Sensu Go in your IT infrastructure according to your specific requirements.
Monitoring strategy and design:
Develop an effective monitoring strategy and architecture. Help establish monitoring rules, checks, and notifications.
Scalability optimization
Scale your Sensu Go infrastructure to efficiently handle the monitoring of multiple sites and thousands of endpoints.
Automation
Configure automatic actions and responses to events to enable proactive resolution of issues.
Integration with other tools
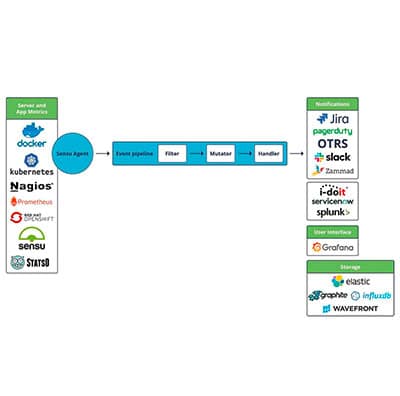
Seamless integration with existing tool chains, including notification platforms and dashboards and management systems.
Performance analysis and reporting
Develop custom reporting and dashboards, for insights into the health and performance of their IT infrastructure.

Sensu Go on place 2 of the FIVE MUST HAVE tools in modern IT infrastructures. Awarded by Forbes Magazine. Read about the many advantages in the article now!


Sensu Go on place 2 of the FIVE MUST HAVE tools in modern IT infrastructures. Awarded by Forbes Magazine. Read about the many advantages in the article now!
Your advantages with Sensu Go
Sensu Go is the key when you are stuck with Nagios
Easy scaling for monitoring very large infrastructures
Your advantages with us as a partner
becon is the first Sensu partner worldwide
Comprehensive open source monitoring know-how is our strength
We also rely on market standards for visualization and data management
We deliver the all-round carefree package for Sensu, Grafana and many other monitoring tools.
Sensu Go – Workflow Automation for Monitoring
Sensu Go is an open source monitoring event pipeline written in Golang. Sensu Go can be used to monitor the health of servers, virtual machines, containers, network devices, as well as applications, services and more.
About
Maximum flexibility with Sensu Go
Sensu Go features a high level of flexibility and is designed to monitor everything from the server rack to the cloud. An unlimited number of event pipelines consisting of filters, mutators, and handlers can validate and correlate monitoring events, modify data formats, send notifications, manage incidents, and collect metrics.
The architecture of Sensu Go, which follows the basic idea of microservices, facilitates the integration of the monitoring system into already existing solutions and processes.
We help you with the introduction.
About
Sensu-Backend and Sensu-Agent
Sensu Go consists of the two components Sensu-Backend and Sensu-Agent. The communication is encrypted via WebSockets.
While the Sensu backend is the server component, the Sensu agent is installed on the systems to be monitored.
Etcd instances integrated into the Sensu backend are used to store configuration and live data. Etcd, which is also used by Kubernetes, is a distributed NoSQL key-value store and works using Raft (https://raft.github.io/), a “consensus algorithm”. If Sensu is to be used as a cluster with multiple instances, the data replicates automatically by adding additional Sensu backend instances.
Sensu agents, on the other hand, automatically log on to the Sensu backend or Sensu backend cluster, perform their designated checks, and continuously send keepalive messages. The publish-subscribe approach to triggering monitoring checks can save a lot of computing power compared to traditional monitoring solutions. The Sensu agents are assigned subscriptions, which can also be understood as tags. On the other hand, the monitoring checks (e.g. CPU, memory, disks, processes, etc.) are also categorized based on subscriptions. If a check is triggered and has for example the subscription “webserver”, all Sensu agents with the subscription “webserver” will execute this check.
Sensu Go comes into its own in cloud and cloud-like environments where there is a lot of dynamism and high turnover of hardware or software. With the help of automation tools such as Ansible, Chef, Puppet and SaltStack, the monitoring content in Sensu Go automatically adapts to the changed IT landscape in real time, without an administrator having to manually maintain it in the monitoring.
Further information about Sensu Go can be found on the manufacturers website www.sensu.io.

Grafana – the cross-platform open source application
For graphical representation of data from data sources such as InfluxDB, MySQL, PostgreSQL, Prometheus and Graphite.
Cloud Monitoring
Modern monitoring with Sensu Go:
Automated system monitoring and event control

Sensu Go: The MUST HAVE tool in modern IT infrastructures
The open-source, API-driven monitoring tool Sensu Go provides flexible monitoring of the health of servers, CPUs, network devices and appliances, as well as containers, VMs and functions in the cloud. It bridges the old world to the new without having to reinvent everything. Nagios plug-ins can still be used with Sensu Go. Forbes Magazine named Sensu #2 of the FIVE MUST HAVE tools in modern IT infrastructures.
In this technical article, Christian Michel, Head of Infrastructure at becon GmbH, describes automated system monitoring and event control with Sensu Go and many other insights. By the way, becon GmbH is the world’s first Sensu partner.
Request technical article now for free
Your Benefits
Sensu is compatible with Nagios Check Plug-Ins
In addition to the possibility of collecting real metrics in a time series database, the conventional checks from the community can be used. Migrations from Nagios and Co. to Sensu are thus flexible and smoothly implementable.

Webinar: Sensu Go | The New Monitoring Event Pipeline. From the architecture over functions up to first application examples.
becon blog
More articles on this topic
Contact
Instant contact
Do you have any questions, suggestions, requests or are you facing a particular challenge? We look forward to hearing from you!


